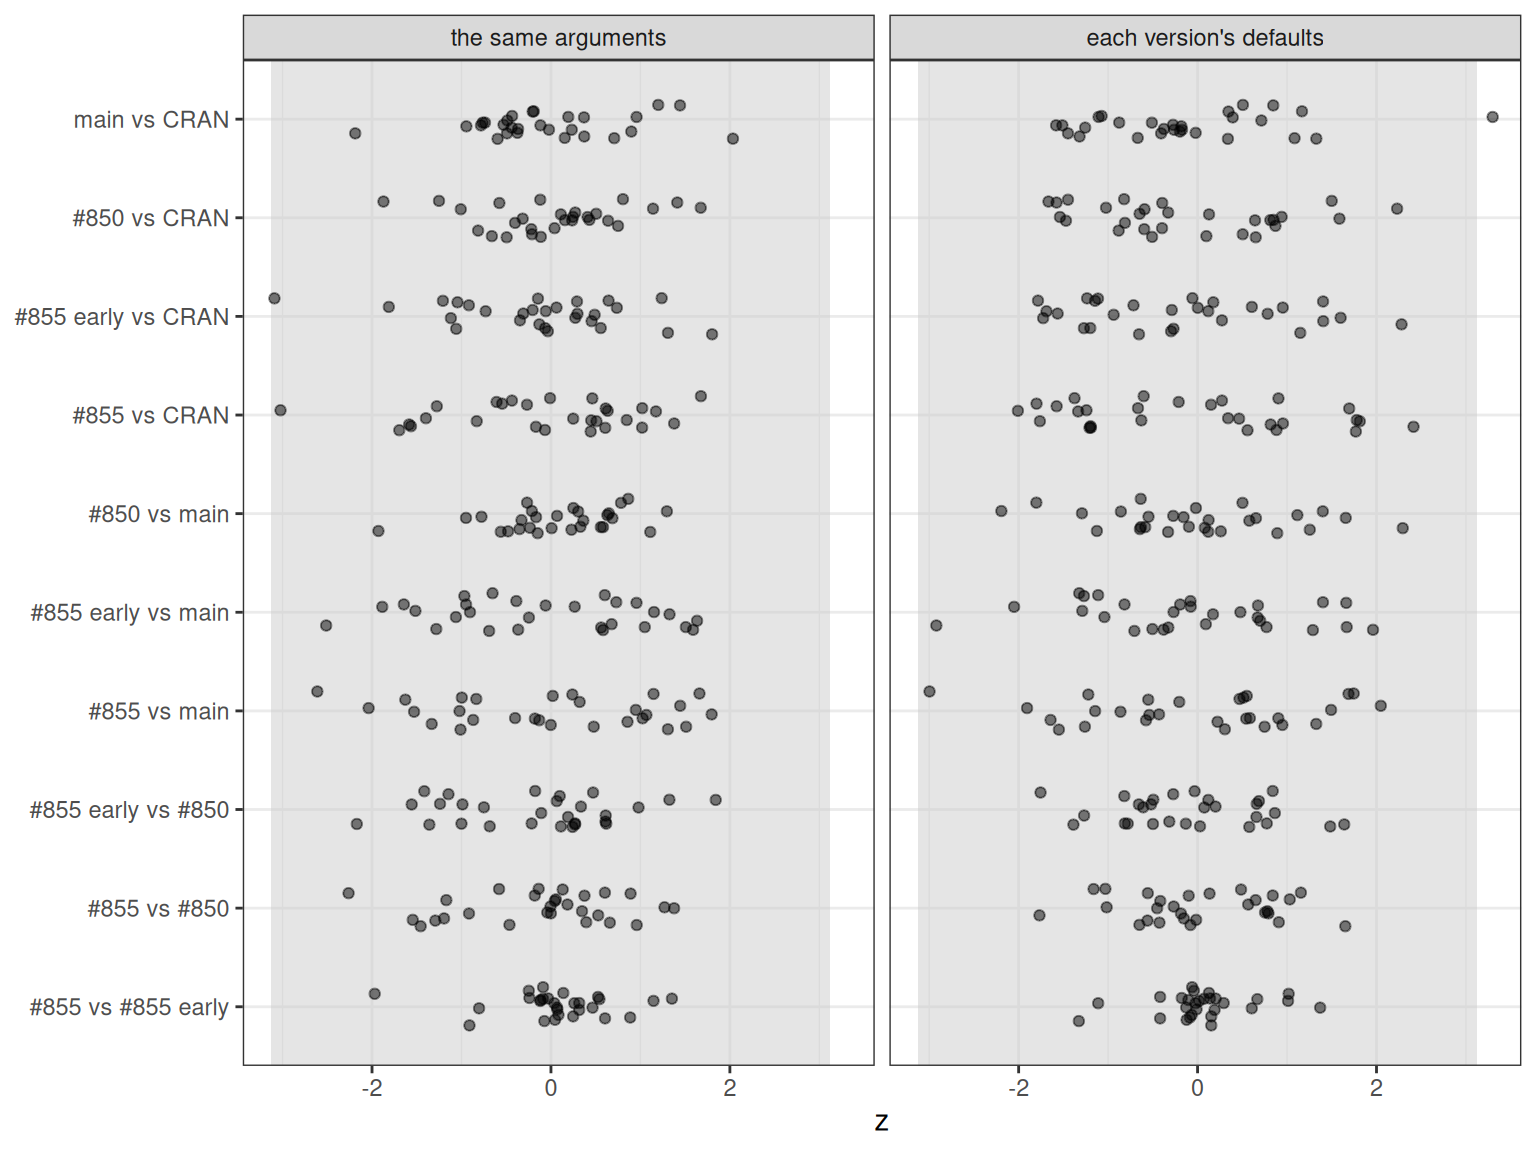
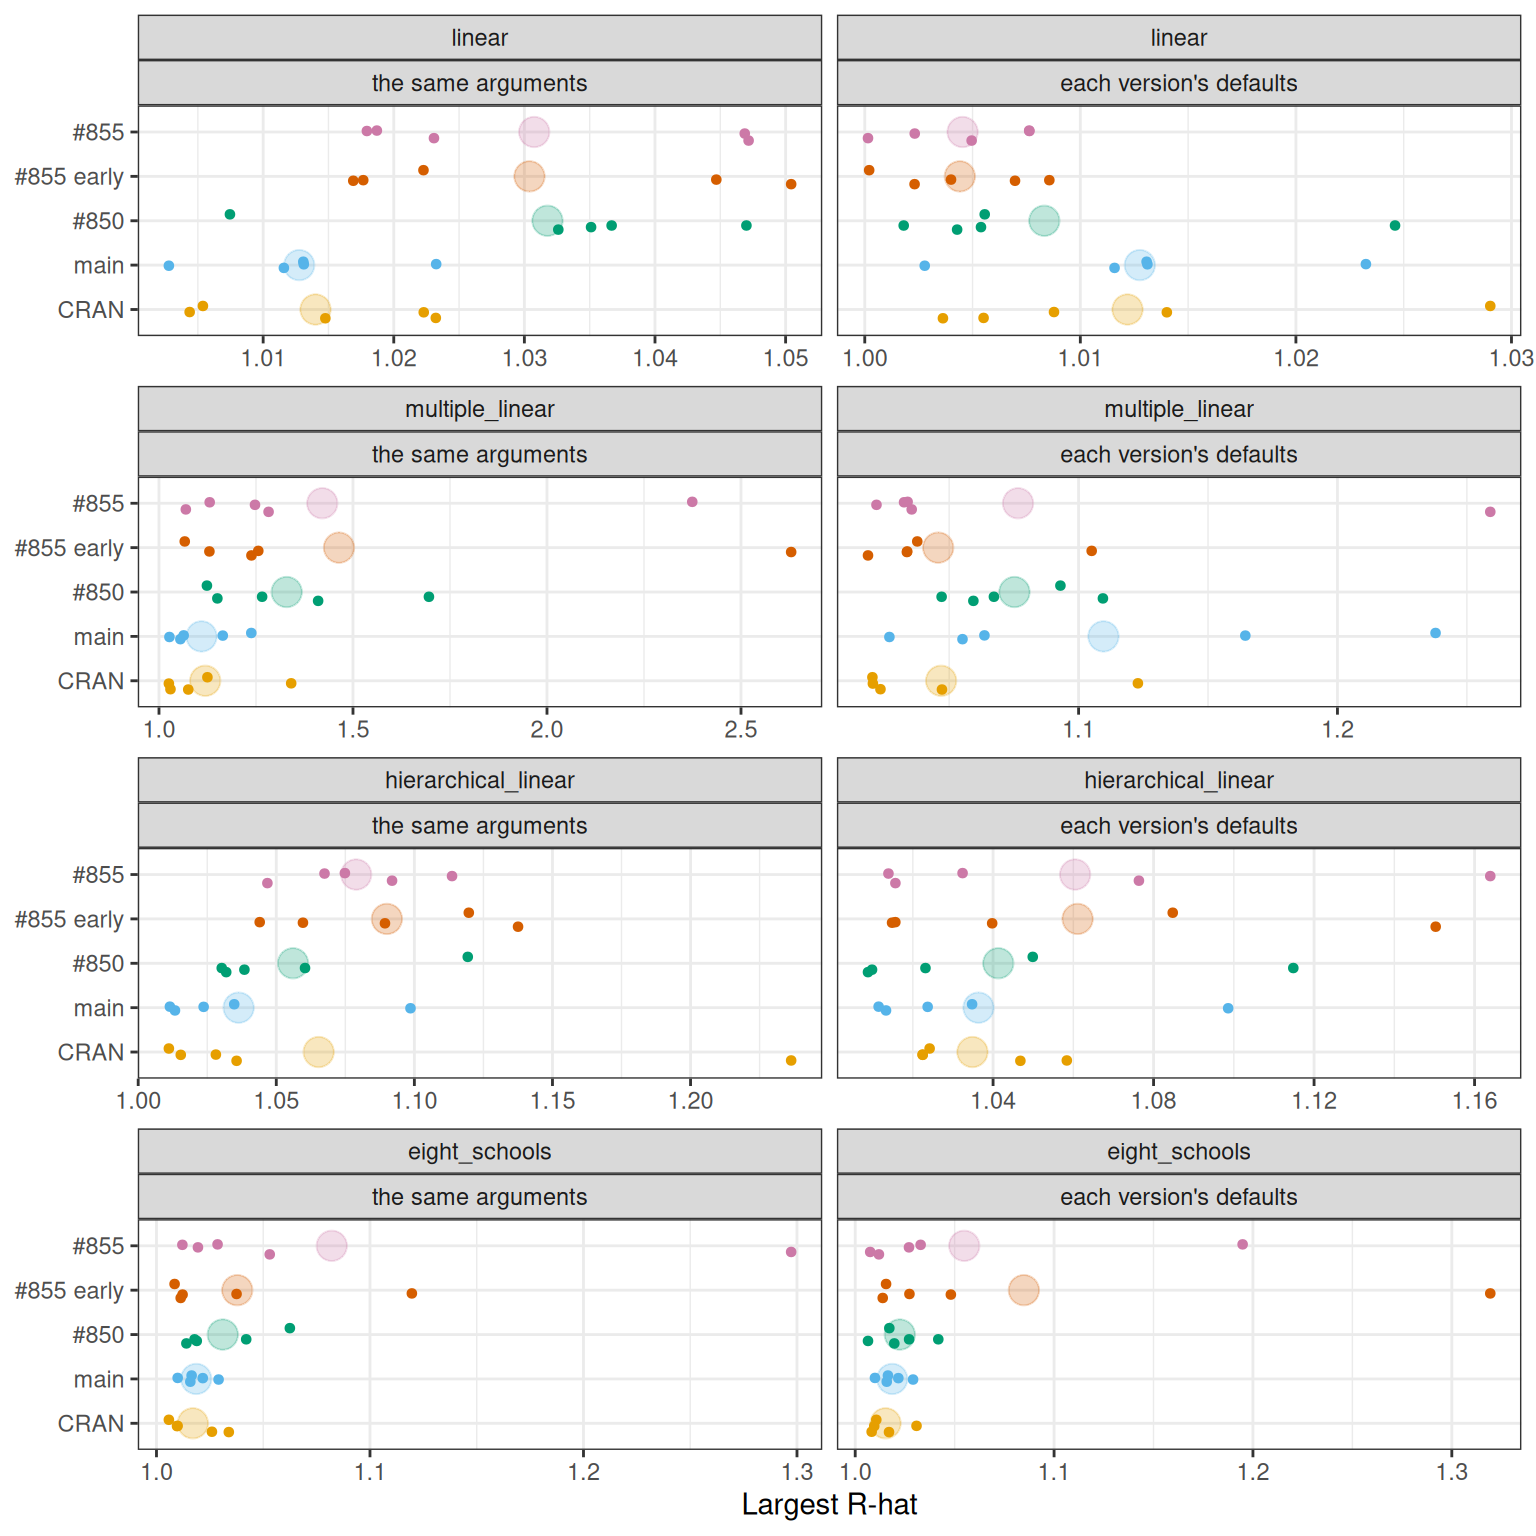
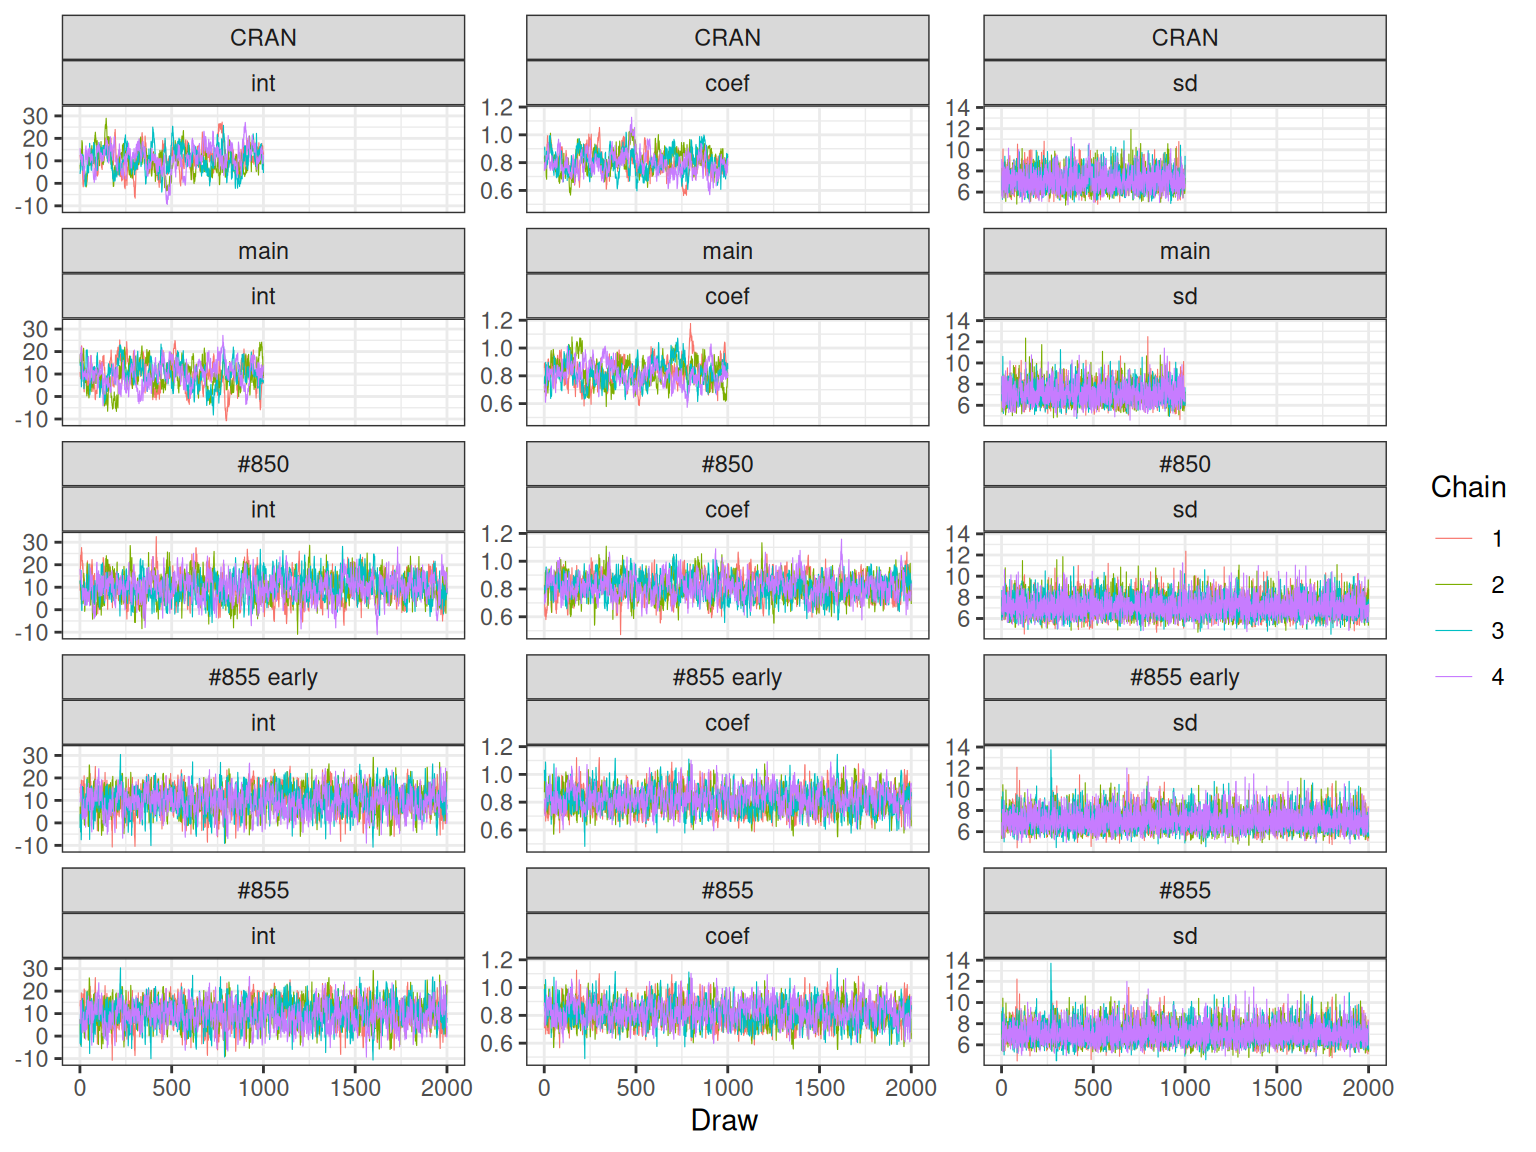
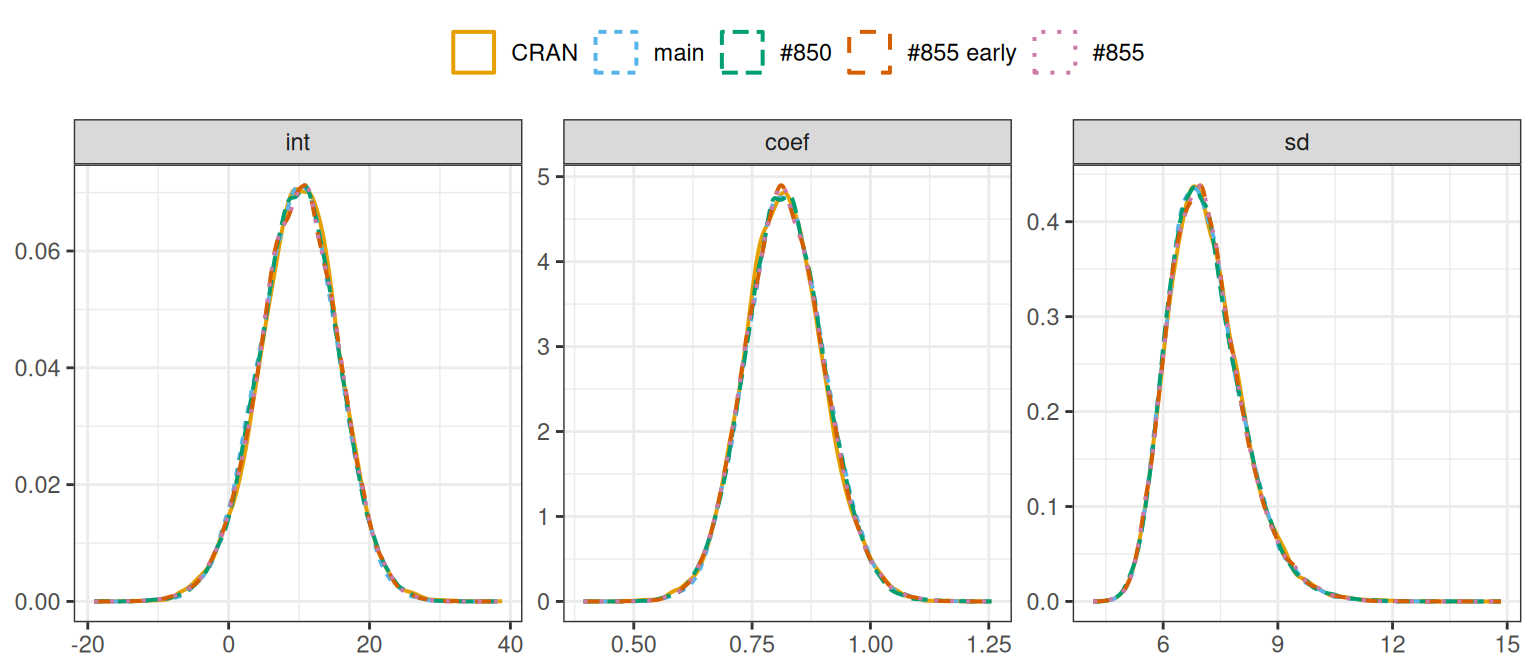
library(dplyr)
library(tidyr)
library(ggplot2)
library(bench)
library(here)

post_path <- "posts/2026-10-07-tf-warmup-i547"

# each `# ---- label ----` section of the scripts, shown below by its label
knitr::read_chunk(here(post_path, "benchmark.R"))
knitr::read_chunk(here(post_path, "run.R"))

# links to the scripts on GitHub, at the commit being rendered when GitHub
# Actions renders the site
github_ref <- Sys.getenv("GITHUB_SHA", "main")
github_file_url <- function(file) {
  paste0(
    "https://github.com/greta-dev/greta.benchmarks/blob/",
    github_ref,
    "/",
    post_path,
    "/",
    file
  )
}
# Quarto escapes the markdown in an inline `{r}` result unless it is wrapped
# in I(), so the link helpers return I()
file_link <- function(file) {
  I(paste0("[`", file, "`](", github_file_url(file), ")"))
}

# a link to the lines of a script's `# ---- label ----` section
section_link <- function(file, label) {
  lines <- readLines(here(post_path, file))
  headings <- grep("^# ---- .+ ----$", lines)
  start <- headings[lines[headings] == paste("# ----", label, "----")]
  end <- c(headings, length(lines) + 1)[match(start, headings) + 1] - 1
  while (end > start && !nzchar(trimws(lines[end]))) {
    end <- end - 1
  }
  I(paste0(
    "[`", label, "`](", github_file_url(file), "#L", start, "-L", end, ")"
  ))
}

# links to several sections of a script: "`a`, `b` and `c`"
section_links <- function(file, labels) {
  links <- vapply(labels, \(label) section_link(file, label), character(1))
  I(paste_and(unname(links)))
}

# white panels, so the grey band in Agreement shows
theme_set(theme_bw())

sessions <- list.files(
  here(post_path, "results"),
  pattern = "^session-[0-9]+[.]rds$",
  full.names = TRUE
) |>
  lapply(readRDS)

# run.R names the versions as they were when this ran. The PR, greta#855, has
# since taken the tf-warmup-i547 branch, so the page relabels them: tf-warmup
# is an earlier commit of the PR, and branch is the PR at 5bdab31e
version_labels <- c(
  CRAN = "CRAN",
  main = "main",
  `#850` = "#850",
  `tf-warmup` = "#855 early",
  branch = "#855"
)
pr_label <- version_labels[["branch"]]

versions <- sessions[[1]]$versions
# pak installed branch from a worktree, which the results record as a local
# path; run.R names the same commit on GitHub
on_github <- c(
  branch = "greta-dev/greta@5bdab31e9ec9295c845a4fac9d1201e1aabb9c93"
)
installed_locally <- startsWith(versions, "local::")
versions[installed_locally] <- on_github[names(versions)[installed_locally]]
names(versions) <- version_labels[names(versions)]
version_levels <- names(versions)
version_colours <- setNames(
  c("#E69F00", "#56B4E9", "#009E73", "#D55E00", "#CC79A7")[seq_along(
    version_levels
  )],
  version_levels
)
bench_settings <- sessions[[1]]$results[[1]]$bench_settings
n_sessions <- length(sessions)

# one row per session and version, holding that version's results
runs <- lapply(sessions, function(session_file) {
  result_names <- names(session_file$results)
  tibble(
    session = session_file$session,
    version = factor(
      unname(version_labels[result_names]),
      levels = version_levels
    ),
    position = match(result_names, session_file$order),
    results = unname(session_file$results)
  )
}) |>
  bind_rows()

model_levels <- names(runs$results[[1]]$mcmc_same)
# benchmark.R's section labels spell each model with hyphens
model_sections <- gsub("_", "-", model_levels)
setting_levels <- c("the same arguments", "each version's defaults")

# a part of the results that is a table or a value per run, stacked, with the
# run it came from
stack_tables <- function(part) {
  pieces <- lapply(seq_len(nrow(runs)), function(i) {
    values <- runs$results[[i]][[part]]
    if (!is.data.frame(values)) {
      values <- tibble(value = values)
    }
    tibble(session = runs$session[i], version = runs$version[i], values)
  })
  bind_rows(pieces)
}

# a part of the results that is a bench_mark per model, or one per run,
# stacked into one bench_mark, with the run and model each came from
stack_marks <- function(part) {
  pieces <- list()
  for (i in seq_len(nrow(runs))) {
    marks <- runs$results[[i]][[part]]
    if (inherits(marks, "bench_mark")) {
      marks <- list(marks)
    }
    for (j in seq_along(marks)) {
      mark <- marks[[j]]
      mark$session <- runs$session[i]
      mark$version <- runs$version[i]
      mark$model <- if (is.null(names(marks))) NA_character_ else names(marks)[j]
      pieces[[length(pieces) + 1]] <- mark
    }
  }
  vctrs::vec_rbind(!!!pieces)
}

provenance <- stack_tables("provenance")
sampler_iterations_per_draw <- stack_tables("sampler_iterations_per_draw")
opt_marks <- stack_marks("opt_adam")
opt_marks$setting <- NA_character_

# the two sets of timed mcmc() calls, stacked, with which arguments each used
same_marks <- stack_marks("mcmc_same")
same_marks$setting <- setting_levels[1]
defaults_marks <- stack_marks("mcmc_defaults")
defaults_marks$setting <- setting_levels[2]
mcmc_marks <- vctrs::vec_rbind(same_marks, defaults_marks)

# one row per timed call: bench keeps every call's time in the `time` column
every_call <- function(marks) {
  marks |>
    as_tibble() |>
    select(session, version, model, setting, time) |>
    mutate(call = lapply(time, seq_along)) |>
    unnest(c(time, call)) |>
    mutate(
      seconds = as.numeric(time),
      model = factor(model, levels = model_levels),
      setting = factor(setting, levels = setting_levels),
      .keep = "unused"
    )
}

# bench's own summary() of each mark, with the mean and longest of its calls
# added, all in seconds
bench_summary <- function(marks) {
  summaries <- summary(marks, filter_gc = FALSE)
  tibble(
    session = summaries$session,
    version = summaries$version,
    model = summaries$model,
    setting = summaries$setting,
    min = as.numeric(summaries$min),
    median = as.numeric(summaries$median),
    mean = vapply(marks$time, \(time) mean(as.numeric(time)), numeric(1)),
    max = vapply(marks$time, \(time) max(as.numeric(time)), numeric(1)),
    `itr/sec` = summaries$`itr/sec`,
    n_itr = summaries$n_itr,
    total_time = as.numeric(summaries$total_time)
  )
}

# The first call on a model traces its TensorFlow functions; later calls on the
# same model reuse them.
label_calls <- function(call) {
  last <- max(call)
  later <- if (last == 2) {
    "second call"
  } else if (last == 3) {
    "calls 2 and 3"
  } else {
    paste0("calls 2 to ", last)
  }
  factor(
    ifelse(call == 1, "first call", later),
    levels = c("first call", later)
  )
}

# three significant figures each, where format() would pad a vector to the
# decimal places of its smallest value; formatC() pads to a common width, so
# trim that
format_number <- function(x) {
  trimws(formatC(signif(x, 3), format = "fg", digits = 3, big.mark = ","))
}

# "CRAN 10.6, main 11.2, #843 0.643"
versions_text <- function(version, value) {
  paste(paste(version, format_number(value)), collapse = ", ")
}

# "CRAN, main and #843"
paste_and <- function(x) {
  if (length(x) <= 1) {
    return(x)
  }
  paste(paste(x[-length(x)], collapse = ", "), "and", x[length(x)])
}

# "2.49 to 3.21": the range over models of a ratio with #855 as its unit, from
# a table of each version's `lowest` and `highest`, filtered by `...`
ratio_range <- function(ratios, version_label, ...) {
  row <- filter(ratios, version == version_label, ...)
  paste(format_number(row$lowest), "to", format_number(row$highest))
}

version_scale <- scale_colour_manual(values = version_colours, guide = "none")
version_fill <- scale_fill_manual(values = version_colours, guide = "none")
jitter <- position_jitter(width = 0, height = 0.2, seed = 2026)

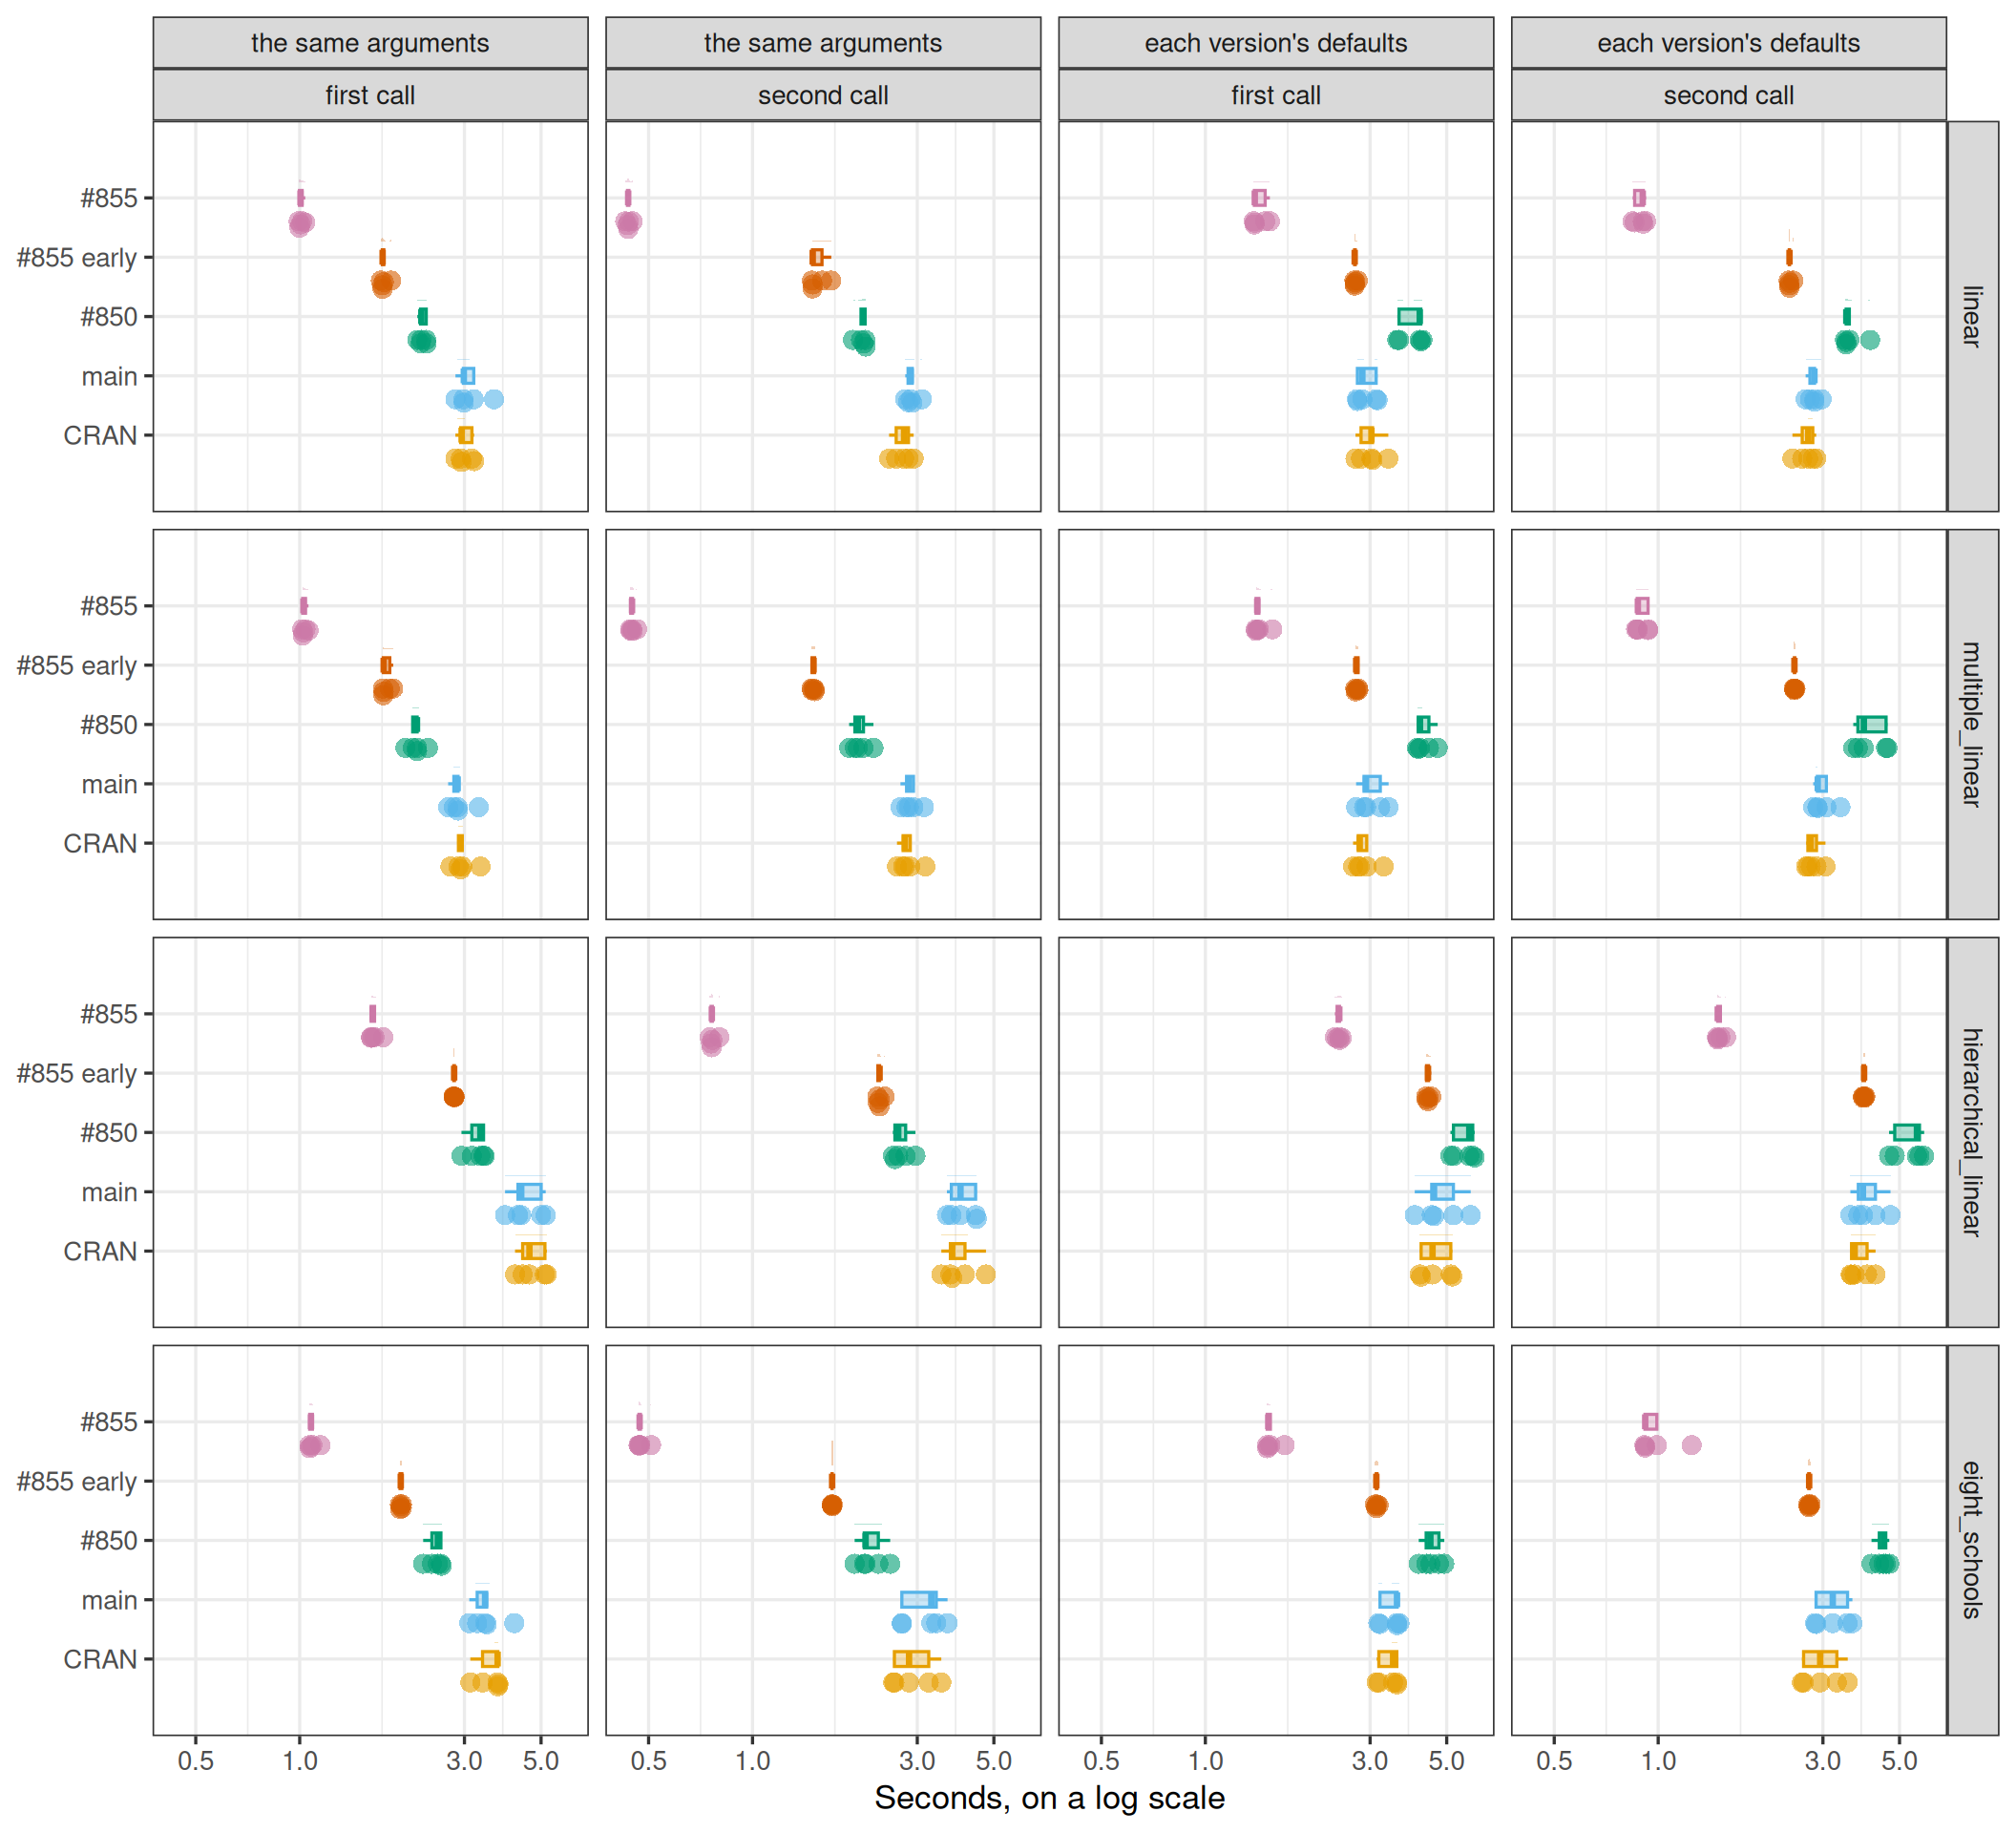
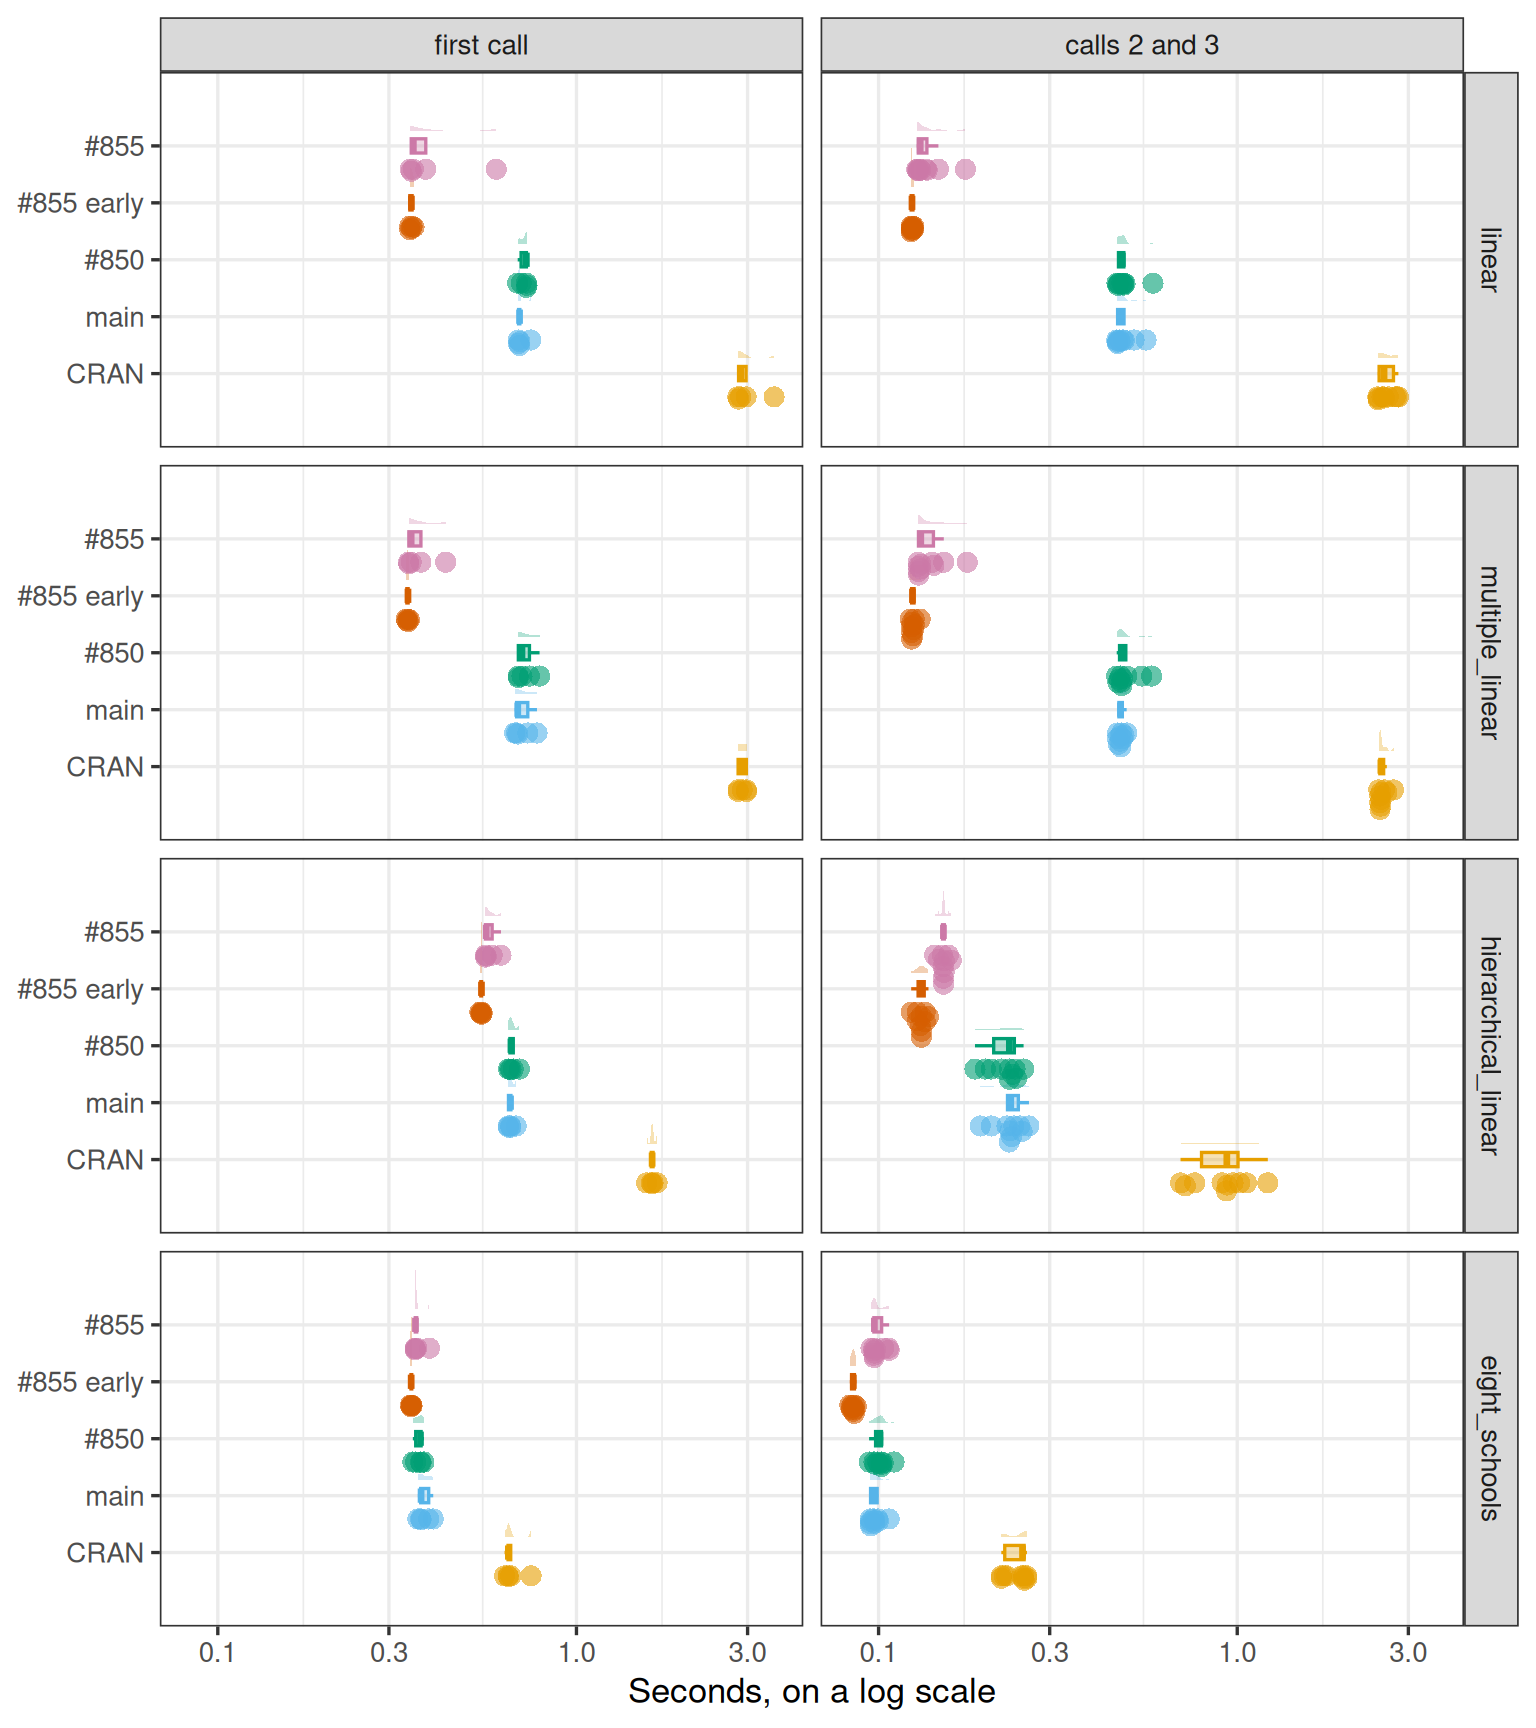
# A raincloud for each version: the density of its calls above, their box plot
# in the middle, and every call as a dot below. The summaries are drawn first
# and faint, so the dots sit on top.
raincloud <- list(
  ggdist::stat_halfeye(
    aes(fill = version),
    width = 0.4,
    justification = -0.3,
    .width = 0,
    point_colour = NA,
    alpha = 0.3
  ),
  geom_boxplot(
    aes(fill = version),
    width = 0.25,
    outlier.shape = NA,
    alpha = 0.3
  ),
  # a fixed dot size, so a call looks the same size in every panel
  ggdist::stat_dots(
    aes(fill = version),
    side = "bottom",
    layout = "swarm",
    justification = 1.3,
    scale = 0.75,
    binwidth = unit(2.6, "mm"),
    overflow = "compress",
    colour = NA,
    alpha = 0.6
  ),
  version_scale,
  version_fill,
  theme_bw(base_size = 13)
)
raincloud_caption <- "Each dot is one call, from one session. Above the dots, the curve is the density of the calls and the box marks their median and quartiles."
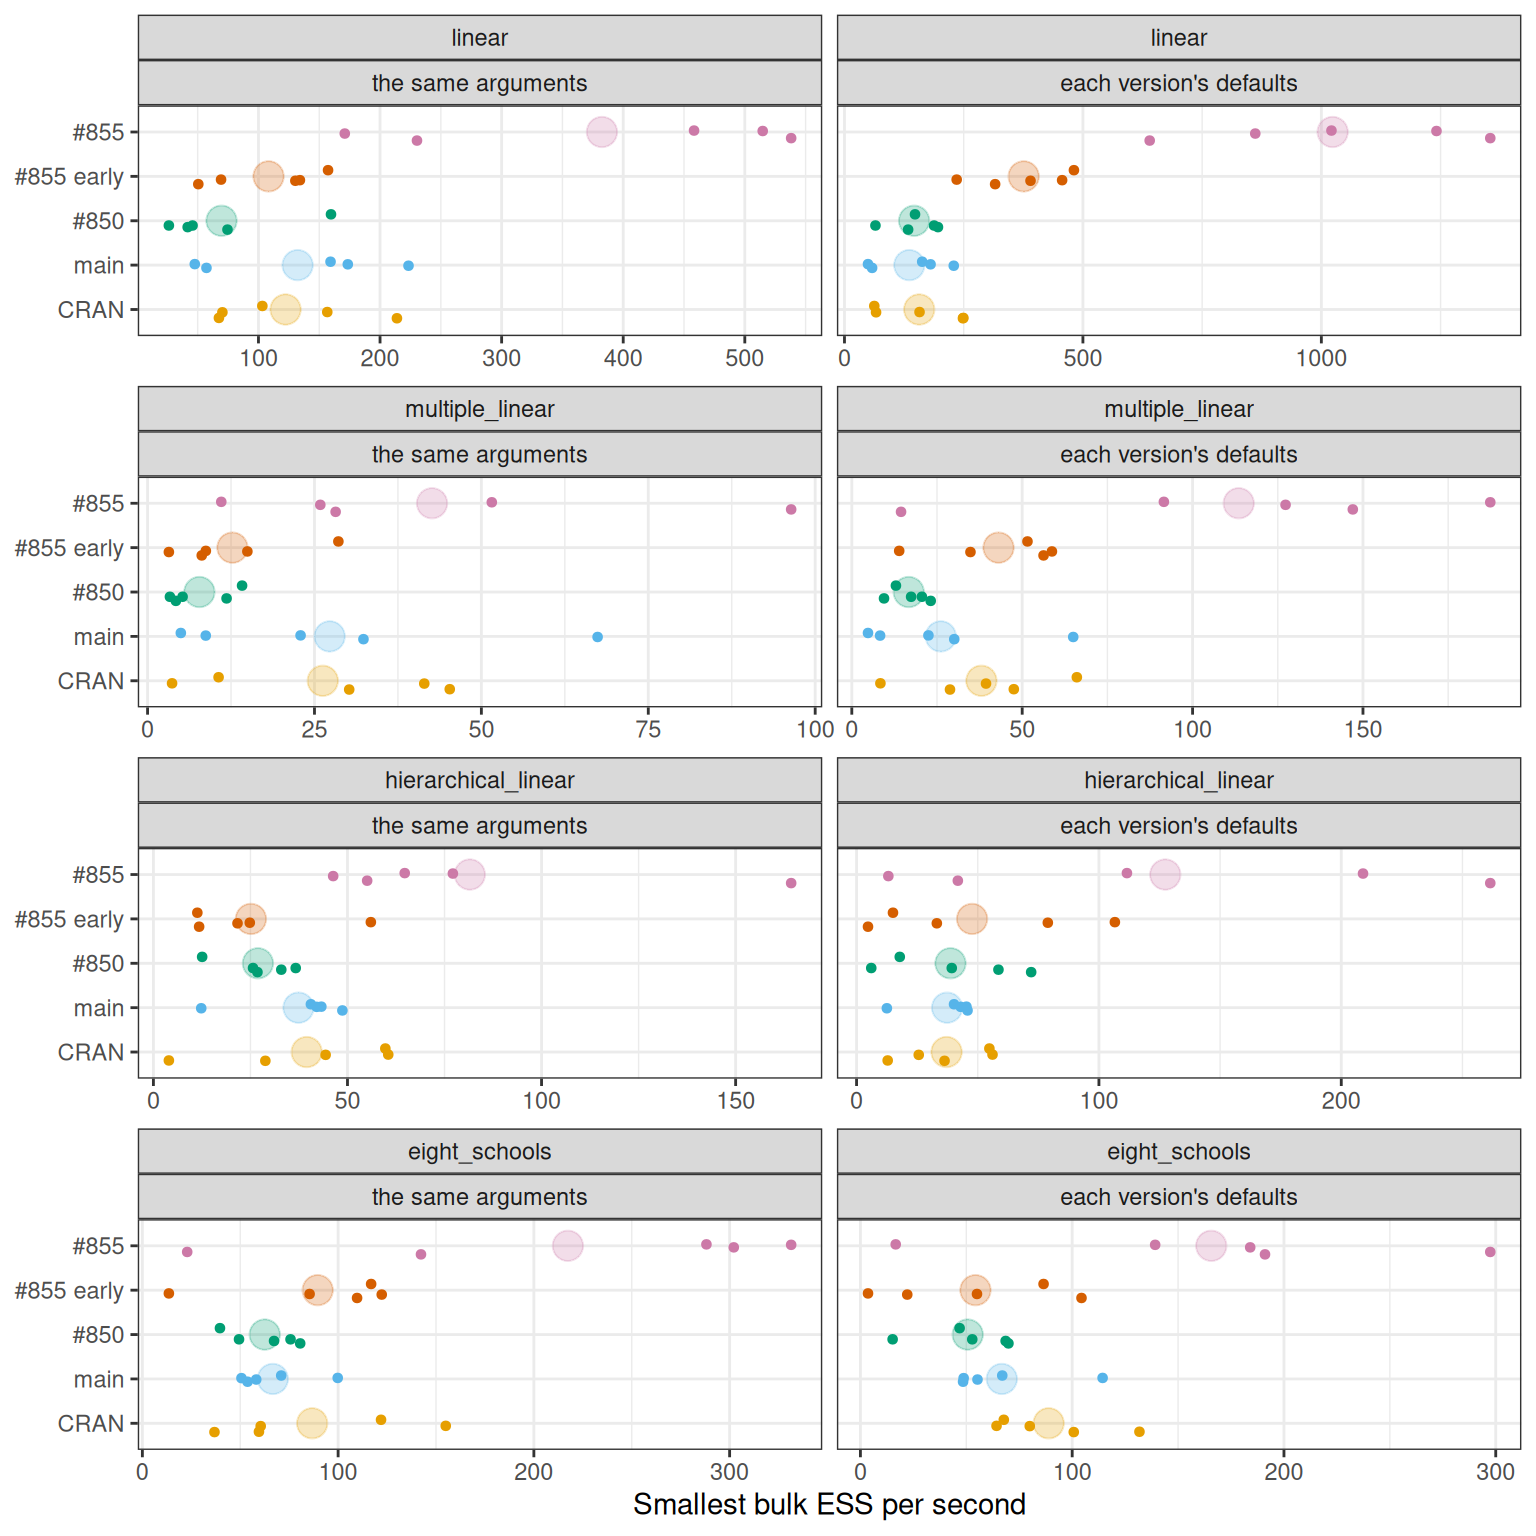
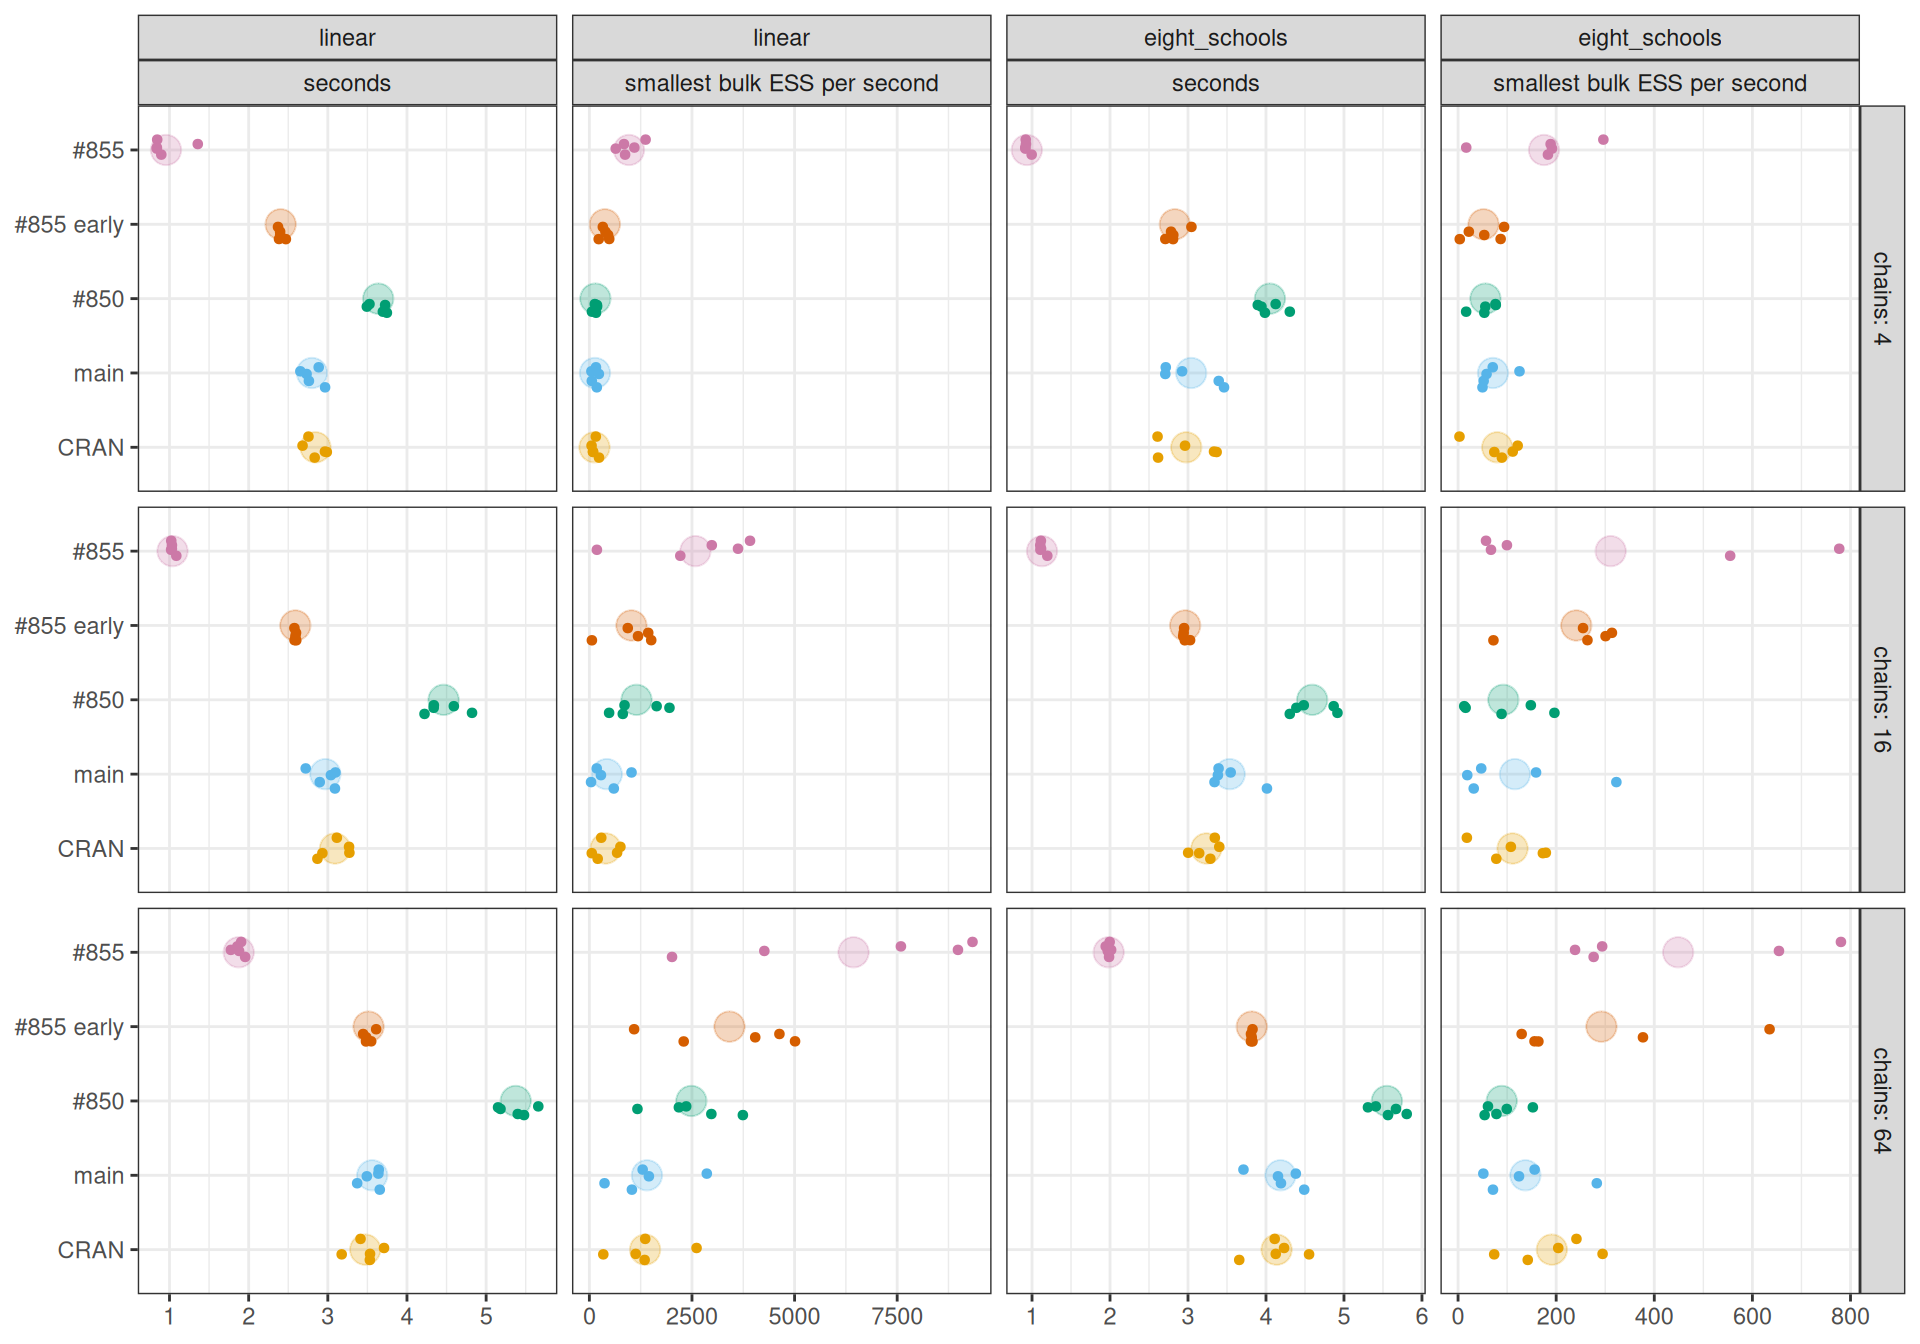
session_caption <- "Each small dot is one session's second call. The large faint dot behind them is their mean."

# a searchable table, its numbers rounded for reading
dt_table <- function(data, digits = 3) {
  table <- DT::datatable(
    data,
    rownames = FALSE,
    filter = "top",
    options = list(pageLength = 10, autoWidth = TRUE)
  )
  decimal_columns <- names(data)[vapply(data, is.double, logical(1))]
  if (length(decimal_columns) == 0) {
    return(table)
  }
  DT::formatRound(table, decimal_columns, digits)
}

# The PR at a glance, which the opening quotes: this post's mcmc() calls and
# the call overhead post's, on CRAN and the PR
glance_rows <- c(
  "`mcmc()`, each version's defaults, first call",
  "`mcmc()`, each version's defaults, calls after the first",
  "`mcmc()`, 1000 warmup and 1000 draws, calls after the first",
  "`mcmc()` with the progress bar, 1000 and 1000, calls after the first",
  "`mcmc()` with `one_by_one = TRUE`, 200 and 200, calls after the first",
  "`opt()` with `adam()`, 2000 iterations, first call",
  "`opt()` with `adam()`, 2000 iterations, calls after the first"
)

this_post_calls <- every_call(mcmc_marks) |>
  filter(version %in% c("CRAN", pr_label)) |>
  mutate(
    row = case_when(
      setting == setting_levels[2] & call == 1 ~ glance_rows[1],
      setting == setting_levels[2] & call > 1 ~ glance_rows[2],
      setting == setting_levels[1] & call > 1 ~ glance_rows[3]
    ),
    post = "[this post](#speed)"
  ) |>
  filter(!is.na(row)) |>
  select(row, post, version, model, seconds)

# the call overhead post names the PR `branch`. Each bench_mark keeps every
# call's time, and opt()'s has one row per iteration limit, of which this
# table takes 2000
overhead_path <- "posts/2026-10-07-call-overhead-i547"
overhead_sessions <- list.files(
  here(overhead_path, "results"),
  pattern = "^session-[0-9]+[.]rds$",
  full.names = TRUE
) |>
  lapply(readRDS)
calls_of <- function(time) {
  tibble(call = seq_along(time), seconds = as.numeric(time))
}
overhead_calls <- lapply(overhead_sessions, function(session_file) {
  lapply(c("CRAN", "branch"), function(version) {
    result <- session_file$results[[version]]
    lapply(names(result$mcmc), function(model) {
      mcmc_runs <- result$mcmc[[model]]
      opt_runs <- result$opt[[model]]
      bind_rows(
        calls_of(mcmc_runs$progress$time[[1]]) |>
          mutate(row = if_else(call > 1, glance_rows[4], NA)),
        calls_of(mcmc_runs$one_by_one$time[[1]]) |>
          mutate(row = if_else(call > 1, glance_rows[5], NA)),
        calls_of(opt_runs$time[[which(opt_runs$max_iterations == 2000)]]) |>
          mutate(row = if_else(call == 1, glance_rows[6], glance_rows[7]))
      ) |>
        mutate(version = version, model = model)
    }) |>
      bind_rows()
  }) |>
    bind_rows()
}) |>
  bind_rows() |>
  filter(!is.na(row)) |>
  mutate(
    version = if_else(version == "branch", pr_label, version),
    post = "[Call overhead](../2026-10-07-call-overhead-i547/#summary)"
  ) |>
  select(row, post, version, model, seconds)

glance_calls <- bind_rows(this_post_calls, overhead_calls) |>
  mutate(
    version = if_else(version == "CRAN", "CRAN", "PR"),
    model = as.character(model)
  )

glance_seconds <- glance_calls |>
  group_by(row, post, version) |>
  summarise(seconds = median(seconds), .groups = "drop") |>
  pivot_wider(names_from = version, values_from = seconds)

glance_ratios <- glance_calls |>
  group_by(row, version, model) |>
  summarise(seconds = median(seconds), .groups = "drop") |>
  pivot_wider(names_from = version, values_from = seconds) |>
  group_by(row) |>
  summarise(
    models = n(),
    lowest = min(CRAN / PR),
    highest = max(CRAN / PR),
    .groups = "drop"
  ) |>
  mutate(version = "CRAN")